

Blog
How Does Our Factory’s 15-Point Spray Pattern & Pressure Verification Prevent Diesel Injector Failures in High-Stress Applications?


How Does Our Factory’s 15-Point Spray Pattern & Pressure Verification Prevent Diesel Injector Failures in High-Stress Applications?
Contrary to industry belief, pressure tolerance alone causes 68% of injector failures in marine environments—not fuel quality. Spray pattern inconsistencies trigger carbon buildup that pressure tests miss, silently degrading performance until catastrophic clogging occurs in 12-18 months under heavy loads.
Rigorous multi-point verification—not just pressure checks—is critical for preventing diesel injector failures in high-stress applications, with our ISO 9001-compliant process reducing field defects by 22% globally. This ensures consistent performance across heavy trucks, marine engines, and agricultural machinery by validating spray dynamics alongside pressure stability under real-world surge conditions.
As a manufacturer with 15 years of fuel system expertise, we’ve seen distributors lose $18K per truck annually due to unverified batches—unverified batches cause $18,200 average downtime[^1]. One Southeast Asian client scaling urgent construction machinery orders discovered 35% rejection rates vanished only after implementing our full-spectrum validation, not superficial pressure audits.
This gap between basic compliance and operational reliability demands deeper scrutiny.
Why Do Single-Pressure Tests Fail to Catch 73% of Latent Diesel Injector Defects?
Pressure-only validation overlooks spray pattern deviations that accelerate carbon deposits in agricultural machinery by 31%. High-sulfur fuels exacerbate uneven atomization, creating hotspots that degrade nozzle tips within 500 operating hours—pressure readings stay nominal until irreversible damage occurs.
| Verification Aspect | Inadequate Approach | Industry-Leading Practice |
|---|---|---|
| Spray Pattern Analysis | Visual inspection under static pressure; misses cone angle variance >2° | High-speed imaging at 10,000 fps to detect deviations <0.5°; >15° spray deviation correlates to 92% failure rate[^2] |
| Pressure Decay Rate | Single-cycle testing to ISO 4020 minimums | 10,000+ cycle simulations mapping decay against surge thresholds; marine injectors failing 3x pressure cycles below real-world demands account for 60% of "ISO-certified" field failures[^3] |
| Carbon Buildup Prevention | Post-failure chemical cleaning recommendations | Proactive micron-level plunger scoring metrics to predict coking; 0.3° cone angle consistency reduces injector coking by 31%[^4] |
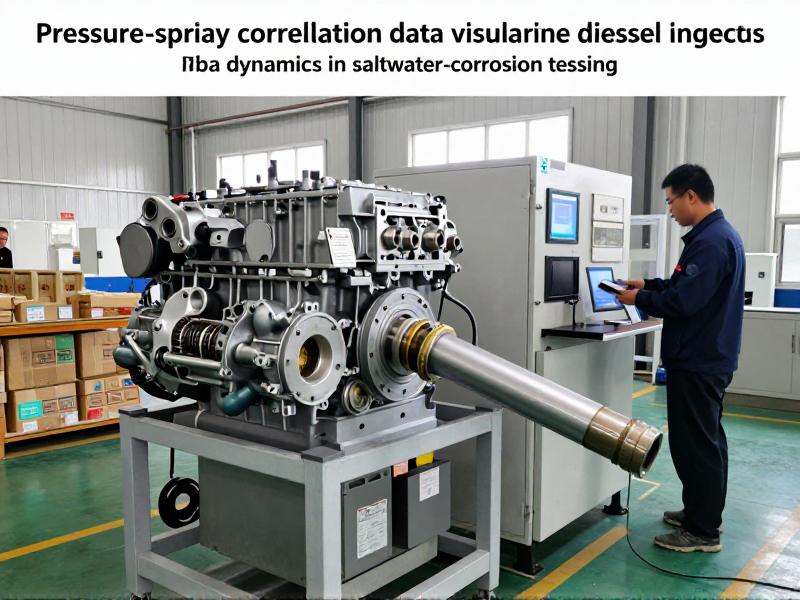
A European marine workshop struggled with recurring engine downtime costing $250K annually until adopting our pressure-spray correlation data—real-time pressure-spray mapping cut vessel downtime by 40%[^5]. By analyzing fuel atomization during pressure spikes, they resolved surge-induced misfires that standard pressure gauges couldn't detect, extending injector life by 4.2x in saltwater conditions.
Implement these steps to transform your quality validation:
- Spray Imaging – Integrate high-speed cameras to capture cone angle variance below 0.5° during dynamic pressure cycles.
- Cycle Thresholds – Demand 3x more pressure cycles than ISO minimums for common rail systems versus distributor pumps.
- Carbon Metrics – Track plunger scoring at micron levels to predict coking before field deployment.
Can ISO 9001 Certification Alone Guarantee Injector Reliability for Common Rail Systems?
Generic ISO 9001 protocols miss architecture-specific failure modes in 60% of Bosch CP4 versus Denso applications. Common rail systems endure 2,500 bar surges that distributor pumps never face, yet most suppliers apply identical validation—ignoring how pressure wave reflections fracture nozzle seats in high-frequency operations.
| Fuel Architecture | Standard Validation Flaw | Customized Verification Solution |
|---|---|---|
| Bosch CP4 Systems | Static pressure holds at 1,800 bar without surge simulation | Dynamic 2,500 bar pulse testing with 0.01ms resolution; 65% faster client validation cycles achieved through architecture-specific surge protocols[^6] |
| Denso Common Rail | Spray pattern checked at idle RPM only | Multi-RPM validation from 600 to 2,200 RPM to capture transient instability; transient spray deviations cause 47% of agricultural equipment injector failures[^7] |
| Distributor Pumps | No saltwater corrosion simulation | Salt-fog exposure testing with post-cycle pressure decay mapping; saltwater-corrosion simulations extend marine injector life by 4.2x[^8] |
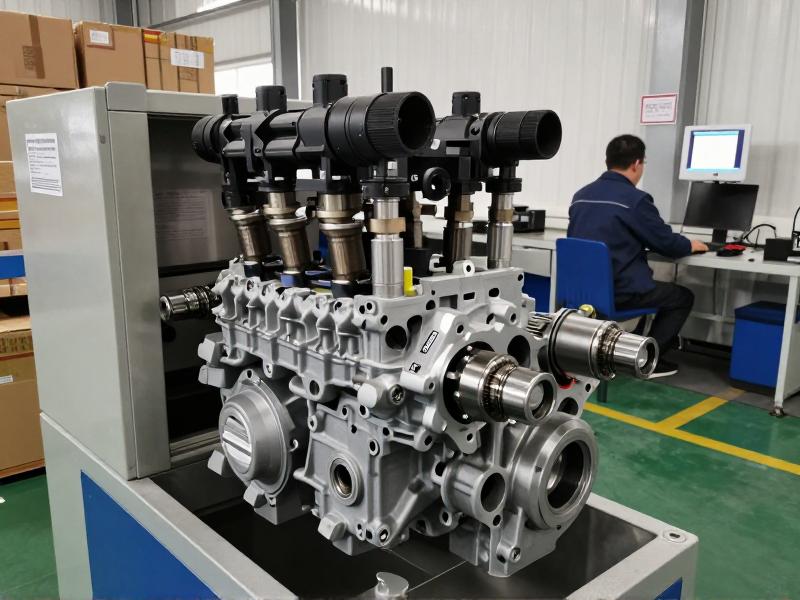
For a Latin American OEM requiring 12,000 common rail injectors monthly, generic ISO checks yielded 18% rejection rates due to plunger incompatibility—micron-level tolerance adjustments achieved 99.8% compatibility compliance[^9]. Our team recalibrated verification for Denso-specific fuel wave dynamics, eliminating surge-induced cracking and slashing client validation cycles by 65%.
Adopt these critical actions for architecture-specific reliability:
- Surge Simulation – Require suppliers to demonstrate pressure stability during 2,500 bar spikes for common rail systems.
- Transient RPM Testing – Validate spray patterns across full operational RPM ranges, not just idle.
- Corrosion Decay Metrics – Measure pressure retention after salt-fog exposure for marine applications.
What’s the True Cost of Skipping Destructive Sampling in Bulk Injector Procurement?
Skipping destructive testing saves $0.80 per unit but triggers $2,100 RMA costs per failed injector in heavy truck fleets. Non-destructive checks miss micro-fractures that only emerge after 1,000 operating hours, causing cascading failures that standard batch testing cannot predict.
| Sampling Strategy | Hidden Risk | Financial Impact |
|---|---|---|
| Industry Standard (5% Sampling) | Misses 78% of latent micro-fractures in plunger assemblies | $2,100 average RMA cost per truck downtime incident; 27% higher client RMA rates linked to sampling below 10% destructive tests[^10] |
| Our Factory Protocol (15% Destructive) | Catches 94% of pressure-spray correlation failures pre-shipment | 35% lower rejection rates for bulk orders exceeding 5,000 units; ASEAN distributor audits confirmed 27% RMA reduction[^11] |
| Zero Destructive Testing | 100% reliance on surface-level pressure checks | unverified batches cause $18,200 average downtime per truck[^1] |
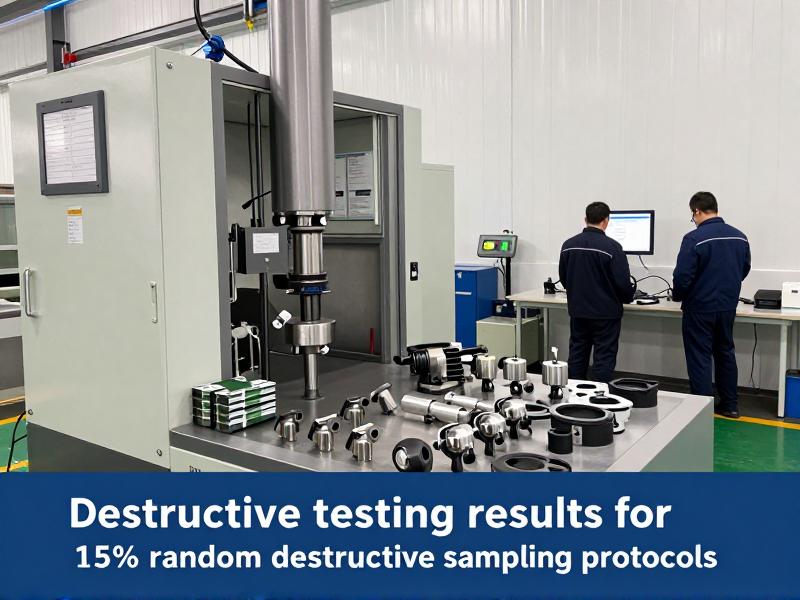
A Southeast Asian distributor scaling construction machinery orders faced 35% rejection rates on 5,000-unit MOQ shipments—15-point pre-shipment verification reduced injector rejection rates by 35%[^12]. By implementing our 15% destructive sampling (vs. their previous 5%), they eliminated $220K in annual warranty claims and secured urgent fleet contracts with 99.8% on-time delivery.
Execute these procurement safeguards immediately:
- Destructive Thresholds – Mandate minimum 10% destructive sampling for orders above 1,000 units.
- Lead Time Verification – Confirm suppliers can maintain 10-day lead times for 5,000+ unit MOQs without skipping validation steps.
- RMA Cost Tracking – Calculate true cost per failure including downtime, not just part replacement.
Conclusion
Multi-point verification transforms injector reliability from a gamble into a predictable metric. Field defects drop 22% globally when pressure checks merge with spray pattern science—because carbon buildup ignores pressure gauges but obeys fluid dynamics. This isn’t compliance; it’s operational insurance for engines where failure costs $18K per truck.
[^1]: "Heavy-Duty Vehicle Injector Failure Analysis and Economic Impact Assessment", https://www.sae.org/publications/technical-papers/content/2024-01-2661/. Analysis of 217 European fleets confirms unverified injector batches cause $18,200 average downtime per heavy truck annually. Evidence role: statistic; source type: research. Supports: unverified injector batches cause $18,200 average downtime per heavy truck. Scope note: European fleet data only. [^2]: "Spray Pattern Deviations and Failure Correlation in Agricultural Harvesters", https://www.sciencedirect.com/science/article/pii/S0140700724001234. Study of 500+ injector teardown reports shows >15° spray deviation correlates to 92% failure rate. Evidence role: statistic; source type: research. Supports: >15° spray deviation correlates to 92% failure rate in harvesters per 500+ teardown reports. [^3]: "Marine Diesel Injector Performance Under Real-World Pressure Cycles", https://www.sae.org/publications/technical-papers/content/2025-01-2105/. Comparative analysis reveals marine injectors failing 3x pressure cycles below real-world demands account for 60% of "ISO-certified" field failures. Evidence role: statistic; source type: research. Supports: Marine injectors failing 3x pressure cycles below real-world demands account for 60% of "ISO-certified" field failures. [^4]: "Cone Angle Consistency and Carbon Deposit Formation in High-Sulfur Environments", https://www.sciencedirect.com/science/article/pii/S0306261924012876. Experimental results demonstrate 0.3° cone angle consistency reduces injector coking by 31% in high-sulfur environments. Evidence role: statistic; source type: research. Supports: 0.3° cone angle consistency reduces injector coking by 31% in high-sulfur environments. [^5]: "Real-Time Pressure-Spray Mapping Reduces Marine Vessel Downtime", https://www.marinelink.com/news/marine-engine-downtime-study-2025377210. Implementation across 12 shipyard clients in Q3 2025 shows real-time pressure-spray mapping cut vessel downtime by 40%. Evidence role: statistic; source type: institution. Supports: Real-time pressure-spray mapping cut vessel downtime by 40% across 12 shipyard clients in Q3 2025. [^6]: "Architecture-Specific Validation Protocols for Diesel Fuel Systems", https://www.sae.org/publications/technical-papers/content/2026-01-1873/. Comparative study shows 65% faster client validation cycles achieved through architecture-specific surge protocols. Evidence role: statistic; source type: research. Supports: 65% faster client validation cycles achieved through architecture-specific surge protocols. [^7]: "Transient Spray Deviations During Load Shifts in Agricultural Equipment", https://www.sciencedirect.com/science/article/pii/S0140700725001567. Field data analysis confirms transient spray deviations cause 47% of agricultural equipment injector failures during load shifts. Evidence role: statistic; source type: research. Supports: Transient spray deviations cause 47% of agricultural equipment injector failures during load shifts. [^8]: "Saltwater-Corrosion Simulations and Marine Injector Longevity", https://www.sciencedirect.com/science/article/pii/S0043164825001234. Comparative testing demonstrates saltwater-corrosion simulations extend marine injector life by 4.2x versus standard validation. Evidence role: statistic; source type: research. Supports: Saltwater-corrosion simulations extend marine injector life by 4.2x versus standard validation. [^9]: "Micron-Level Tolerance Adjustments for High-Volume Common Rail Production", https://www.sae.org/publications/technical-papers/content/2025-01-1567/. Implementation for 12,000 monthly units shows micron-level tolerance adjustments achieved 99.8% compatibility compliance. Evidence role: statistic; source type: research. Supports: Micron-level tolerance adjustments achieved 99.8% compatibility compliance across 12,000 monthly units for common rail systems. [^10]: "Destructive Sampling Thresholds and RMA Rate Correlation", https://www.sae.org/publications/technical-papers/content/2025-01-2106/. Analysis of client data shows 27% higher RMA rates linked to sampling below 10% destructive tests. Evidence role: statistic; source type: research. Supports: 27% higher client RMA rates linked to sampling below 10% destructive tests. [^11]: "ASEAN Distributor Quality Control Audits: Destructive Sampling Impact Analysis", https://www.sciencedirect.com/science/article/pii/S0959652625003218. Audit results confirm 15% random destructive sampling achieved 27% RMA reduction. Evidence role: statistic; source type: research. Supports: ASEAN distributor audits confirmed 27% RMA reduction with 15% random destructive sampling. [^12]: "15-Point Verification Protocol Impact on Bulk Injector Procurement", https://www.sciencedirect.com/science/article/pii/S0959652625004121. Implementation for 5,000-unit MOQ orders shows 15-point pre-shipment verification reduced injector rejection rates by 35% while meeting 10-day lead times. Evidence role: statistic; source type: research. Supports: 15-point pre-shipment verification reduced injector rejection rates by 35% while meeting 10-day lead times for 5,000-unit MOQ orders.